Programme overview
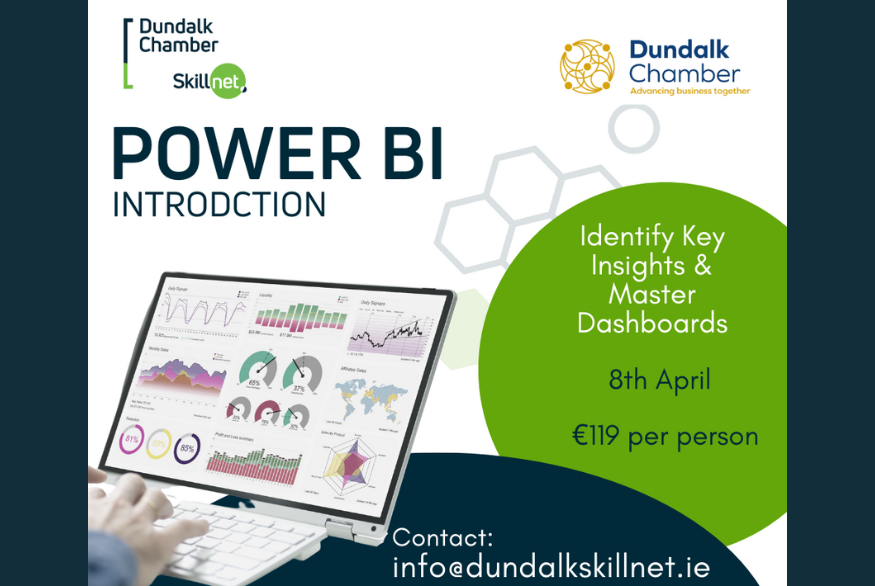
Power BI is a business analytics solution that lets you visualize your data and share insights across your organization, or embed them in your app or website. Connect to hundreds of data sources and bring your data to life with live dashboards and reports.
This programme will show you how to gather data, build the tools to analyse your data, identify new key trends earlier and allow you to share important insights with major stakeholders in your organisation.
Learning Outcomes
On completion of the training programme, participants will:
- Understand the structure of Power BI
- Import data from Multiple sources Eg Cloud, 3rd party apps
- Transform data, including data types, remove & add columns , append data & perform calculations, work with multiple tables & dates.
- Use the Query Editor
- Create a wide range of Visualisations , Including Tables, Multiple Row tables, Extensive range of Graphs, Maps, Tree maps etc.
Who Is This Course For?
This course is best suited to anyone who deals with large amounts of data to generate reports and dashboards
Modules
- Creating a visualisation and setting up Slicers to filter Data.
- The desktop Interface.
- Getting data from various sources.
- Interaction between Visualisations.
- Transforming and correcting data.
- Creating custom columns.
- Creating visualization by asking questions.
- Linking tables.
- Relationships types.
- Getting data from the web.
- Using the append data query.
- Report view


